
50 years of
COMBINED EXPERIENCE
We have the know-how you need.
Scroll Down
01.

02.
We have delivered a wide range of hydrological and water-supply catchment management projects from 2010 to 2021, including LiDAR-based catchment development, sediment and land-use mapping, water-quality monitoring catchments, and large-scale modelling for Melbourne Water and related authorities.

03.
Grace GIS delivered Adelaide’s Green Infrastructure Benchmark and Mapping Project in 2015 and 2023, providing baseline benchmarks, updated geospatial datasets, and thematic mapping to support sustainable planning, land-use analysis, and climate-resilient urban strategies.

FEATURED PROJECTS
Grace Detailed-GIS Services is proud to have contributed to a range of prestigious projects across Australia, partnering with government agencies and industry leaders to deliver innovative, high-impact geospatial solutions.
Explore some of our featured projects to see how Grace GIS delivers real-world impact through innovative geospatial solutions.
 Describe your image |  Describe your image |  Describe your image |
|---|---|---|
 Describe your image |  Describe your image |  Describe your image |

The Hughenden Irrigation Project Corporation (HIPCo)

NEWS AND RECOGNITION
HIPCo
In the Media


Blacktown City Council
2017 – Impervious Mapping Using 2014 Aerial Photography
-
Mapped impervious surfaces in Blacktown City using 2014 aerial photography, producing high-resolution geospatial datasets.
-
Results supported urban planning, stormwater management, and environmental sustainability initiatives through thematic maps and spatial analysis.

-
2016 – Development of Nested Subcatchments for Creek Sites in Blacktown City
-
Developed nested subcatchments for creek sites using LiDAR and drainage data, generating an engineered DEM for hydrological analysis.
-
Improved water management, flood mitigation strategies, and urban planning efforts with precise catchment delineation.
The Hughenden Irrigation Project Corporation (HIPCo)
2018 – The Hughenden Irrigation Project Corporation (HIPCo) – Flinders River Irrigation Project (Stage 2)
-
Examined 100 years of rainfall data across three catchments to identify patterns, extreme events, and seasonal trends.
-
Modeled monthly inflows using SWAT, integrating SILO rainfall data and FGARA soil data for hydrological assessments.

2018 – The Hughenden Irrigation Project Corporation (HIPCo) – Flinders River Irrigation Project (Stage 2)
-
Estimated yearly yield at each DAM site using inflow, evaporation, and consumption data.
-
Developed graphs comparing consumption vs. available water to highlight shortages.
-
Mapped gravity-fed irrigation extents for downstream areas of Alstonvale and The Gap DAM.

2018 – The Hughenden Irrigation Project Corporation (HIPCo) – Flinders River Irrigation Project (Stage 2)
-
Reviewed past reports to estimate DAM construction costs in general terms.

2018 – Flinders River Project – Flinders Shire Council
-
Conducted preliminary analysis of dam sites for irrigation planning.
-
Derived catchment areas for Betts Gorge Creek, Flinders River, and Stewart Creek.
-
Calculated storage capacities for different Full Supply Levels (FSL).
-
Estimated yearly surface runoffs using the SWAT model for water availability assessments.
-
Examined water diversion feasibility from Dutton River and Porcupine weir for optimized allocation.

Adelaide City Council
2016 – Solar Access Assessment for Residential Properties in Adelaide
-
Evaluated 290 residential properties for solar panel suitability.
-
Assessed shading risks, urban growth impacts, and heritage constraints.
-
Provided geospatial data for informed solar PV system installations and sustainable energy adoption.

2015 & 2023 – Green Infrastructure Benchmark Data and Mapping Project
-
Established baseline benchmarks for Adelaide’s green infrastructure (2015).
-
Provided spatial data and thematic maps to support sustainable urban planning.
-
Updated geospatial datasets, analysed land use changes, and refined strategies for climate resilience and urban sustainability (2023).
Ballarat City Council
2017 – Development of 3D Building Footprints for Ballarat City Council
-
Converted and updated Ballarat’s building footprint data into a 3D geospatial dataset.
-
Integrated LiDAR elevation attributes to enhance spatial accuracy.
-
Provided a foundational dataset for urban planning, visualization, and advanced technologies like VR and AR.
2016 – Green Infrastructure Benchmark Data Mapping for Ballarat City Council
-
Mapped Ballarat’s public tree canopy as polygons to transition from point-based data, improving spatial accuracy.
-
Provided detailed geospatial datasets, thematic maps, and percentage-based statistics.
-
Supported urban sustainability and climate adaptation planning.
Bayside City Council
2012 – Tree Canopy Mapping and Change Detection for Bayside City Council
-
Mapped and analyzed tree canopy coverage changes between 2007 and 2012.
-
Identified areas of gain and loss to support urban forestry initiatives.
-
Findings contributed to green infrastructure planning and climate adaptation strategies.

2007 – High-Resolution Land Use/Land Cover (LULC) Mapping for Bayside City Council
-
Delivered precise geospatial datasets for urban planning and environmental management.
-
Established a detailed baseline for impervious surfaces, tree canopy, green spaces, and water bodies.
-
Provided foundational data for sustainability and policy development efforts.


City of Melbourne
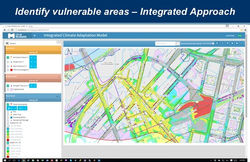
2015 – Integrated Climate Adaptation Model (ICAM) for the City of Melbourne
-
Developed a predictive model for extreme climate event impacts.
-
Optimized infrastructure investments by integrating flood mitigation and drought resilience strategies.
-
Enhanced stormwater management through advanced hydrological analysis.
2008 – Coastal Inundation Modelling Using Bath-Tub Approach
-
Utilized high-resolution LiDAR elevation data to derive inundation extents.
-
Developed flood impact visualizations at 10cm intervals for coastal areas.

2018, 2016, 2015, 2014, 2011, 2008 – Tree Canopy Mapping and Change Detection
-
Monitored changes in tree canopy over multiple years.
-
Supported urban forestry planning and environmental management strategies.
-
Contributed to green infrastructure policies and climate adaptation efforts.
2012 – Compilation of GIS Outputs for Internal Use
-
Standardized GIS datasets for seamless integration within City of Melbourne’s internal systems.
-
Refined building footprints, flood extents, and land cover data using LiDAR and aerial imagery.
2009 – High-Resolution Land Use/Land Cover Mapping for the City of Melbourne Area
-
Developed precise datasets for urban planning and environmental management.
-
Created a baseline for impervious surfaces, green spaces, and water bodies.
Hobsons Bay City Council
2024 – Tree Canopy Mapping
-
Developed tree canopy datasets for Hobsons Bay City Council using advanced geospatial analysis.
2022 – Empowering LGA with Flow Modelling
-
Utilized hydrological modelling to support water management strategies within the local government area.
2022 – Determining Catchments for Hobsons Bay City Council
-
Created detailed catchment delineations to improve flood and drainage planning.


2021 – 1m, 0.1m, and 0.25m Contours Development Using 2018 LiDAR
-
Developed high-precision contour datasets for terrain analysis using LiDAR data.
2017 – Building Footprints Mapping
-
Created accurate geospatial representations of building footprints for urban planning.
2016 – Mapping Speed Humps
2018 – Determining Volumetric Change Since June 2018 Within a Quarry
-
Identified and mapped speed hump locations to enhance transportation planning.
-
Analyzed volumetric shifts within a quarry using spatial data and elevation modelling.

Melbourne Water
2024
-
Development of various types of water supply catchments using LiDAR data
2021
-
Development of catchments for Melbourne Water waterbodies
2014
-
Mapping sediment catchments and quantifying industrial land use
2012
-
Development of catchments for monitoring water quality and bug sites
2011
-
Modelling 60ha and 200ha catchments for Dandenong Valley Authority using LiDAR-based elevation models
2010
-
Updating Melbourne Water primary catchments using LiDAR data
2010
-
Development of engineered catchments for Greenvale Reservoir
2020
-
Melbourne Urban Stormwater Institutional Arrangements Review (MUSIA) – spatial data interrogation for a 150ha catchment model
2019
-
Estimating water velocity from flood extents and elevation models
2024
-
Mapping grass cutting areas in Melbourne Water-managed land
2019
-
Mapping wetlands and water bodies for Melbourne Water area
2023
-
Tree Hazard Management GIS layer update
2017
-
Mapping willows across Melbourne Water’s stream network
2020
-
Mapping tree canopy for 2006 and 2016 across Melbourne Water’s area
2014
-
Mapping tree canopy within Melbourne Water land areas
2012
-
Understory mapping for Melbourne Water areas
2025
-
Optimizing MW vantage points using LiDAR-based viewshed models
2010
-
Mapping revegetation, weed control, and area under management
2024
-
Mapping tree canopy for 2006 and 2016 across Melbourne Water’s area
2023
-
Building footprints mapping and attribute assembly using 2021-23 aerial photos
2024
-
Mapping fuel breaks in Melbourne Water catchments
2015
-
Cathodic protection test points mapping
2018
-
Building footprints mapping and attribute assembly using a combination of LiDAR and aerial photos
2013
-
Updating existing building footprints mapping and attribute assembly
2012
2014
-
Updating MW linear and segment assets
2022
-
Development of MW subcatchments layer (WERG, University of Melbourne)
-
Updating 2009 building footprints mapping and attribute assembly
2010
-
Building footprints mapping and attribute assembly
2016
-
Nested subcatchments for directly connected impervious (DCI) modelling
2016
-
LiDAR-based subcatchment and network modelling for primary catchment areas of Melbourne Water region
CRCSI (CRC for Spatial Information)
2008 - Coastal Inundation Modelling (Bath-tub Approach) for Sydney Botany Bay
-
By fully utilising a high-resolution LiDAR elevation model, inundation extents were derived at 10 cm intervals to visualize the affected areas.

Growth Area Authority
2010 – 3D visualisation and Visibility Analysis
-
Grace GIS used 3D visualisation and visibility analysis to model urban spaces and assess sightlines, supporting smarter planning, design, and infrastructure decisions.
VicRoads
2018 – 3D visualisation
-
Grace GIS applied 3D visualisation to road networks to assess elevation changes, visibility, and surrounding infrastructure. This supports safer, more efficient road design, asset planning, and infrastructure upgrades.